
A Data Center Is Only as Available as Its Maintenance Chain
Behind a working data hall is a chain of transformers, switchgear, UPS, batteries, generators, chillers, cooling towers and pumps. Redundancy on a diagram is not availability. The redundant path also has to be maintainable at the moment it is needed.
Working on a live operating problem? Book Your 20-Minute Assessment
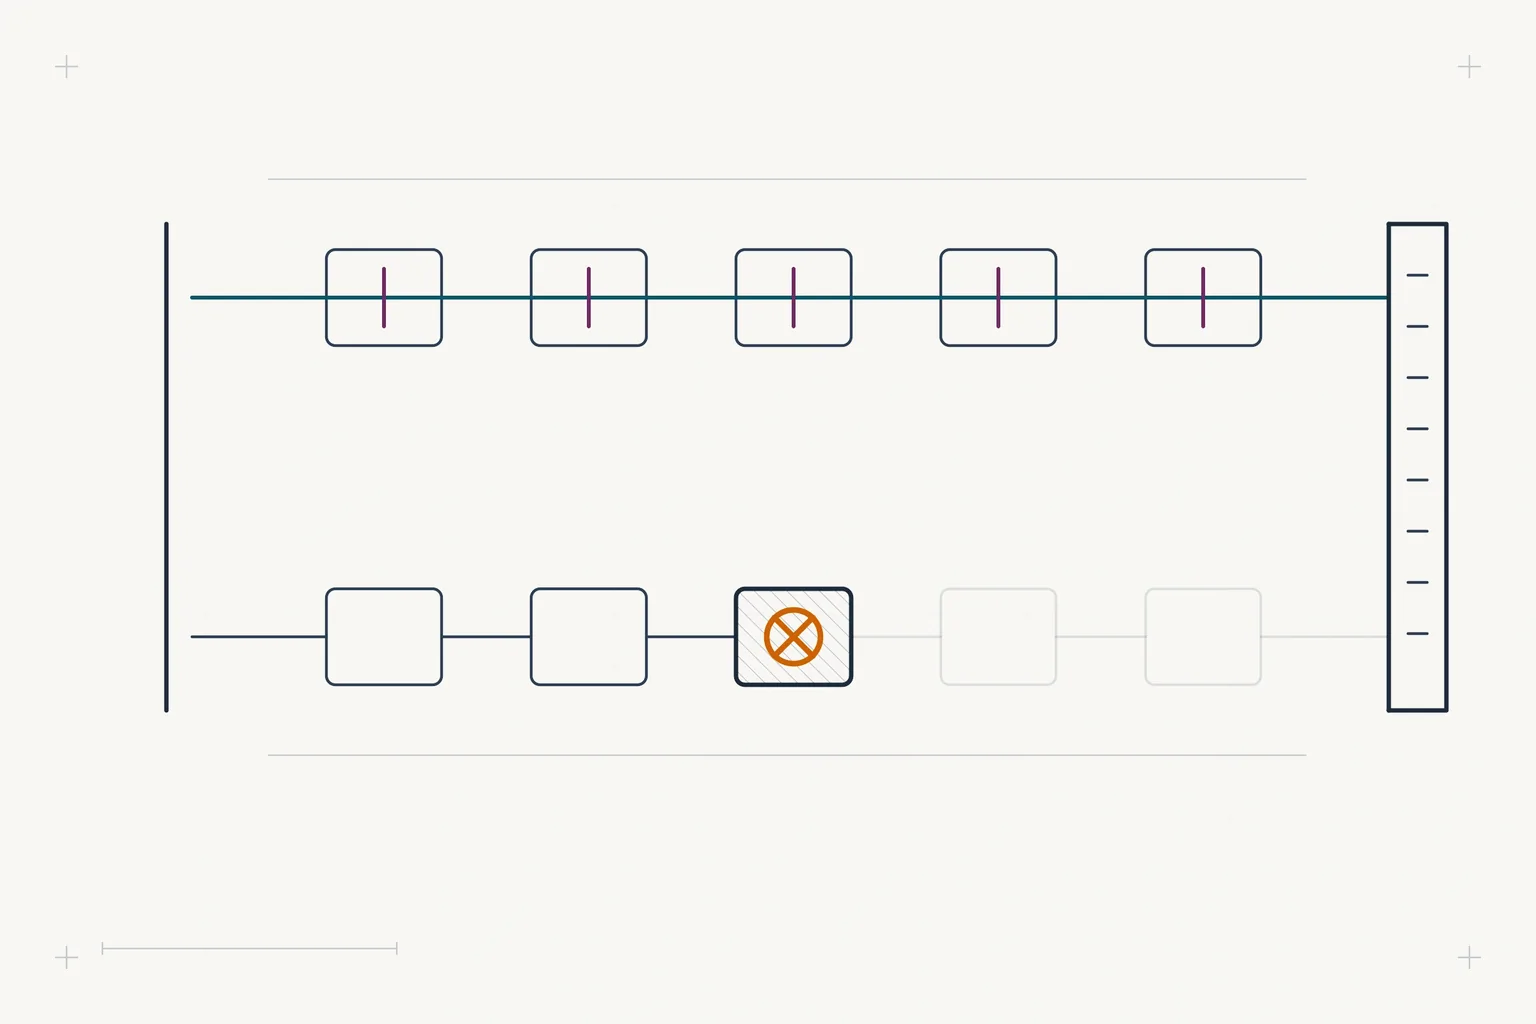
The server rack gets the attention. The equipment keeping the rack alive usually does not.
Behind a functioning data hall is a chain of physical machinery: a utility connection, a substation, transformers, switchgear, uninterruptible power supplies, battery strings, standby generators and their fuel, automatic transfer switches, chillers, cooling towers, pumps, heat exchangers, valves, and the water treatment that stops the cooling loop from destroying itself.
A failure anywhere in that chain can become an availability problem. And every element of it is maintained by people who need parts, procedures, approvals and access.
The scale of what depends on this keeps growing. Lawrence Berkeley National Laboratory’s United States Data Center Energy Usage Report: 2025 Update, published in June 2026, puts its reference case for 2030 data-center electricity use at 649 terawatt-hours, or 11.8 percent of forecast 2030 United States electricity use, with a scenario range of 9.5 to 15.3 percent.
That figure is normally quoted in arguments about generation and grid capacity. It has a second meaning that gets much less attention: it is also a measure of how much physical mechanical and electrical plant now has to be maintained, and of how many chillers, pumps, transformers and battery strings a maintenance organisation somewhere has become responsible for.
The chain, in order
It is worth naming the elements explicitly, because “critical facilities infrastructure” is an abstraction and the failures are not.
Power in. The utility feed, the substation, the incoming transformers, the main switchgear. This is where the largest single-point exposures live, and where lead times for replacement are longest.
Power through. Uninterruptible power supplies, battery strings or flywheels, static transfer switches, power distribution units, busway. The UPS is the element most often assumed to be fine because it has not been asked to do anything.
Backup. Standby generators, automatic transfer switches, day tanks and bulk fuel, fuel polishing. Generators fail at start, which is the only moment they are ever needed, and the failure is usually in the starting system, the fuel, or the controls rather than in the engine.
Heat out. Chillers, cooling towers, condenser and chilled-water pumps, heat exchangers, valves and actuators, makeup water, filtration and chemical treatment. As rack densities rise and liquid cooling spreads, this side of the plant is getting more complex, not less.
And the part that is not equipment. Technicians who are qualified for this specific plant, parts that fit the installed configuration, suppliers who answer, procedures that match what is installed, and approvals that clear inside the window.
That last group is the one that is never on the single-line diagram, and it is the one that decides whether the diagram is true.
Redundancy is a claim about the design. Availability is a claim about Tuesday.
Here is the distinction that matters, and it is the reason a facility with an impeccable topology can still have an availability event.
A redundant system is only redundant if the redundant path is available at the moment the primary fails. And there are ordinary, non-exotic reasons why it might not be.
The B path is out for planned maintenance, and the A path fails during that window. This is the classic one, and it is not a design failure, it is a scheduling and duration problem: the longer maintenance takes, the wider the exposure window, and maintenance duration is largely determined by parts and preparation.
The redundant unit has an undetected fault. A standby generator that has not run under load, a battery string with a weak cell, a chiller whose condenser water valve has been passing for months. Redundancy that has not been proven under load is a hypothesis.
Both paths share something. A common controls system, a common cooling loop, a common fuel supply, a common piece of switchgear upstream. Shared dependencies are found by tracing, and tracing is a documentation exercise most facilities do at commissioning and never again.
The redundant path cannot take the full load for the required duration. Often true and often unknown, because it has been tested for transfer rather than for duration.
Uptime is a chain, and one blocked node takes the rest of its chain with it
Scroll sideways to see the whole drawing.
Figure 1. Uptime is a chain, and one blocked node takes the rest of its chain with it. Three parallel chains all terminating on the same IT load. The power chain runs grid, transformer, switchgear, UPS, distribution. The cooling chain runs chiller, pump, cooling loop, computer room air handler, with the pump node marked as blocked and everything downstream of it drawn faded and dashed. The maintenance chain runs part, supplier, technician, approval, repair, with the part node marked as blocked and everything downstream faded and dashed. A note explains that the cooling chain is blocked at the pump because the pump is blocked at the part, and the part is blocked at an approval.
Why the maintenance chain is the one that breaks
The mechanical and electrical equipment in a data center is, by industrial standards, well maintained. It is monitored closely, serviced on schedule, and operated by competent people. The equipment is rarely the constraint.
The constraint is the chain in the third row, and it breaks in specific places.
Part identity under configuration drift. A chiller that has been in service twelve years has been worked on repeatedly. Compressors rebuilt, control boards replaced with successor revisions, valves substituted. The parts list describes the machine as delivered. The machine as installed has diverged, and the divergence is discovered when a part is offered up during an outage window.
Procedures that no longer match. The method statement was written against the original controls. The controls were upgraded in year six. The procedure was not.
Approval thresholds designed for planned spend. Procurement rules calibrated for capital projects apply unchanged to a Saturday emergency, and the person who can release the threshold is not on the on-call list because on-call was defined as a technical role.
Supplier response as an unmanaged variable. A four-hour response commitment in a contract is a commercial term. Whether it is met is an operational fact, and most facilities do not measure it until they need to argue about it.
Specialist qualification as a single point of failure. Some equipment can only be worked on by a small number of people, sometimes only the OEM. That is a redundancy question about humans, and it rarely appears in any redundancy analysis.
What to measure instead of uptime
Uptime is a lagging indicator with, in a well-run facility, almost no events in it. That makes it useless for management, because it cannot distinguish a facility that is well prepared from one that has been lucky.
Four leading measures are more useful, and all are available without new instrumentation.
Exposure window duration. How long, cumulatively, has each critical system spent operating without its redundant path in the last twelve months. This is the number that maintenance duration directly controls.
Time from fault to ready work. For unplanned events, the interval between detection and the moment a technician had everything needed to start. This is the interval that parts, procedures and approvals control, and it is almost never measured separately.
Part-identity failure rate. How often a part that was believed correct turned out not to fit or not to be present. A rate above a few percent means the asset configuration record is not usable for planning.
Proven-under-load coverage. What proportion of redundant paths have been demonstrated under real load, for the required duration, in the last twelve months. Transfer tests are not this.
The same question applies to the procedure that governs the work. A back-out plan that has never been executed is a hypothesis in exactly the way an untested redundant path is, which is one of the twelve questions in the method-of-procedure review checklist.
Liquid cooling raises the stakes
Rising rack densities are pushing facilities toward direct-to-chip and immersion cooling, and that changes the maintenance profile in ways worth anticipating now.
The consequence of a leak moves from an inconvenience to a hardware event. The fluid becomes a maintained consumable with a specification, a condition, and a supply chain. Coolant distribution units become critical assets with their own failure modes and their own spares. The set of qualified technicians narrows again. And the time available to respond to a cooling fault shortens, because thermal mass at the chip is small.
Every one of those pushes in the same direction: preparation matters more, and the maintenance chain has less slack in it.
Where AIMMS fits
EQUA AIMMS works on the third row of the diagram. It assembles the evidence around a fault in the supporting mechanical and electrical plant with each item traced to its source, reconciles the part record against the installed configuration, checks usable stock, prepares the sourcing route, and routes approvals to the authorised owner with the evidence already attached, so that an exposure window is governed by the work rather than by the coordination around it.
The boundaries are the same ones that apply everywhere on this site. Context from monitoring systems is read only, and AIMMS holds no write path to building management, control or electrical protection systems and issues no setpoints, restarts, interlocks or actuator commands. Qualified people perform the work and authorise return to service.
The question for your own facility
Take the last planned maintenance activity on a critical system. Ask how long the facility ran without its redundant path, and then ask how much of that duration was mechanical work and how much was waiting on something.
Then ask the harder version. If the primary had failed during that window, would the answer have been acceptable to the people who signed the availability commitment.
That is the real availability figure, and it is not on the single-line diagram.
Sources
- Sarah J. Smith, Alex Hubbard, Alex Newkirk, Mohan Ganeshalingam, Billie Holecek, Dale Sartor, Michael Mills and Arman Shehabi, United States Data Center Energy Usage Report: 2025 Update, Energy Analysis Division, Lawrence Berkeley National Laboratory, June 2026. Reference case for 2030: 649 terawatt-hours, representing 11.8 percent of forecast 2030 United States electricity use per the North American Electric Reliability Corporation 2025 Long-Term Reliability Assessment, with a scenario range of 9.5 to 15.3 percent.