Customer-specific value model

Build the case on numbers your finance team already defends.

Five operating assumptions and one investment figure, all of them yours. The model returns an annual value, a break-even month, and a link your team can check line by line. Nothing is calculated until you enter a number, and nothing you enter leaves your browser.

Maintenance sets the operating assumptions. Operations validates the impact. Finance approves the inputs and owns the decision.

The whole model, before you scroll

  1. 01 Downtime value = events x avoidable hours x cost per hour
  2. 02 Labor value = events x coordination hours x loaded rate
  3. 03 Total modeled value = downtime value + labor value
  4. 04 Break-even months = 12 x investment / total modeled value
  5. 05 Modeled ROI = (total modeled value - investment) / investment

That is the entire model. There is no hidden multiplier, no benchmark, and no assumption we did not ask you for.

  • Finance controls every input

    We supply no cost per downtime hour, no loaded labor rate, and no price. A number you cannot defend in a budget review has no business in the model.

  • The arithmetic stays visible

    Two multiplications, one division, one break-even. Read them, argue with them, and reproduce the whole model in your own spreadsheet in five minutes.

  • Nothing is claimed on your behalf

    Every input and output remains visible as your arithmetic on your assumptions. Our measured results are stated separately, further down.

EQUA AIMMS customer-specific value model

Modeled operating value and break-even

Prepared on the date shown by your browser. Model published at equa.work/roi. Every input below was supplied by the reader, not by EQUA AI.

Your assumptions

Start with finance's assumptions, not ours.

Enter the operating assumptions your team can defend. The formulas stay visible, finance controls every input, and no value appears until you supply the numbers.

This model runs entirely in your browser and needs JavaScript to calculate. The five formulas above are the complete model, so you can reproduce it in a spreadsheet without running anything from this site.

Left blank so the model does not imply a standard price. Include your own rollout effort.

Modeled annual value from your inputs

Total modeled value per year

$0

Break-even at these assumptions

Enter investment

Enter your assumptions to produce a result. Nothing is calculated until you do.

Downtime avoided events x avoidable hours x cost per hour
$0
Labor capacity recovered events x coordination hours x loaded rate
$0
Modeled ROI (total modeled value - investment) / investment
Enter investment

This is your arithmetic on your assumptions, not a measurement, forecast, guarantee, or AIMMS result. A measured first deployment replaces the assumptions with your operation's baseline and measured change. Finance controls every input.

Optional refinement

Which delay hours do you believe are removable?

The six inputs above are enough on their own. This layer exists only to help you defend the avoidable-hours figure. Nine of the twelve delay categories are digital coordination AIMMS can move. Three are physical work that stays with people, so the model never counts them. Change nothing and the pre-selection stands.

Delay categories counted as removable
  • 01 Asset access Stays with people
  • 10 Physical repair Stays with people
  • 11 Testing and restart Stays with people

Hatched figures show the modelled structure. Delivery counts only the ordering and coordination time before a shipment moves, never transit time.

Selected scope suggests 5.0 avoidable hours per event.

Inputs supplied by the reader

Model published at equa.work/roi. Every figure above uses assumptions supplied by the reader; EQUA AI supplied none of the inputs. A first deployment replaces those assumptions with a real baseline and a measured change.

Send the model, not a screenshot.

The link below reproduces this exact model: every input, and the delay categories you selected. Anyone who opens it sees the same arithmetic and can change any assumption.

Privacy: the link carries your assumptions after the #, which browsers never send to a server. They stay in the recipient's browser exactly as they stayed in yours: not in our logs, not in any analytics event, and not in any referrer this page hands onward. Treat the link itself like any other internal financial document, because anyone you send it to can read the numbers in it.

How to defend this in a budget review

A conservative model survives the meeting. An optimistic one does not.

01

Two levers only

The model counts downtime avoided and coordination capacity recovered. It deliberately ignores procurement leakage, expert load, record quality, and retained knowledge, because those are easier to claim than to defend. If two levers do not carry the case, the case is not ready.

02

Your cost of adoption belongs in the investment figure

Put integration work, data cleanup, security review, training, and internal time into the investment input. A break-even that excludes your own effort is not a break-even.

03

The control boundary does not move

The model assumes no change to who operates the plant. AIMMS moves permitted digital work. It does not write to PLC, DCS, or SCADA, and it does not execute setpoints, restarts, interlocks, or actuator commands. SCADA and historian context stays read-only.

04

Measurement replaces assumptions

The only way to replace these assumptions is to measure them. A first deployment reconstructs your baseline, runs the workflow for a focused operating period, and reports the change against the number you entered here.

Measured in one anonymized industrial production deployment. They are not a result in your sector, a forecast, or a universal guarantee. Results vary by workflow, asset mix, data quality, operating environment, and customer controls.

Measured first deployment

From baseline to rollout decision.

  1. 01

    Baseline

    Reconstruct recent repairs and quantify where time is spent.

  2. 02

    Onboard

    Target a customizable two-week setup for one consequential workflow, subject to data, security, and user readiness.

  3. 03

    Validate

    Run historical cases and confirm evidence, parts, workflow, and control quality.

  4. 04

    Operate

    Use AIMMS on the approved live workflow for a focused 30-day operating period after readiness.

  5. 05

    Measure

    Compare downtime, ready-work time, expert load, supplier cycle, approvals, and closeout.

  6. 06

    Decide

    Produce a finance-ready rollout case, control model, and expansion scope.

What the waiting is made of

The alarm is not the repair.

Detection is instant. What follows is not. People search for context, verify safety, identify the right part, coordinate suppliers, find authority, and reconstruct the record. The repair is the short part. Draw the same repair twice and you can see where the days actually go.

  • Waiting. Evidence, readiness, parts, authority, approval. Hatched because it is drawn structure, not a measured quantity.
  • The repair. Same width in both records: the same physical work, by the same qualified people.
  • Verified return. The closing edge of the repair block.
  • Time returned. Ground the asset spends running instead of waiting.
Nothing about the repair changes. Both records draw the repair block at one shared width, so the work cannot appear to get shorter and cannot appear to change hands. Physical work and safety-critical authority stay with qualified people. The only thing this figure moves is when the work is able to start. It contains no numbers: it is structure, not measurement.
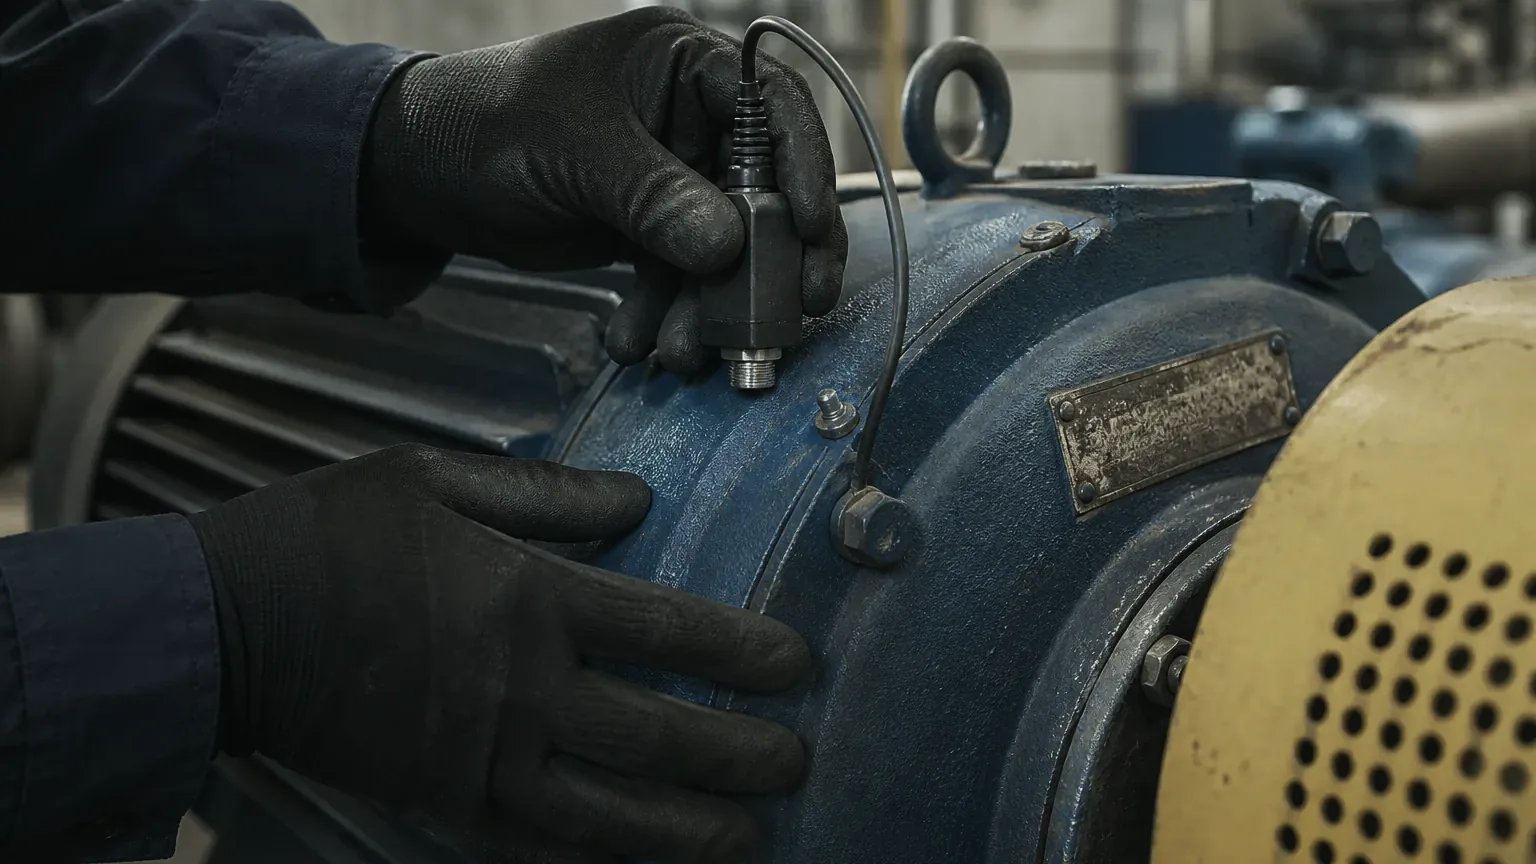
Close inspection of a pump bearing with a vibration sensor
Physical judgment stays in qualified hands.

Four things go missing between the alarm and the fix.

These are the gaps the drawing above is made of. Each one is a place the work is ready and the decision is not.

  1. Evidence Signals, manuals, history and observations sit in different places. The technician proves what the asset already told someone else.
  2. Readiness Safety, people, parts, suppliers and access do not become ready together. Four things are ready and the fifth decides the start time.
  3. Authority The next action waits because the right approval and boundary are unclear. Nobody is refusing. The decision simply has no owner in front of it.
  4. Memory The result closes in fragments, so the next fault starts with rediscovery. The same fault costs the same hours the second time it happens.
See AIMMS Do the Work
Your own arithmetic

The repair takes hours. The waiting takes days.

Your team is not slow. The work around the repair is. Put in your last critical repair and see the split. We do not project a result onto your numbers.

Drag both controls. Use your own last repair.

This section is a calculator. Without JavaScript the controls cannot compute, so the figures beside this paragraph are a worked example on a 38-hour repair rather than anything you entered. The point it makes does not depend on the arithmetic: on a critical repair, most of the elapsed time is spent waiting on coordination rather than on the asset.

The ledger uses only the two values you enter and applies no assumed AIMMS effect.

Your repair 38 h
  • Hands on the asset
  • Waiting on coordination

32 of those hours were waiting. 84% of that repair was coordination, not repair. Your crew was ready for 6 of those 38 hours.

What we measured

In one anonymized industrial production deployment, MTTR fell 14.2 h 9.7 h, a 31.7% reduction.

Measured in one anonymized industrial production deployment. They are not a result in your sector, a forecast, or a universal guarantee. Results vary by workflow, asset mix, data quality, operating environment, and customer controls.

Book Your 20-Minute Assessment
Operational delay decomposition

Do not treat MTTR as one number. Find the hours that are actually removable.

The assessment classifies every elapsed hour of your recent repairs into twelve delay categories. The baseline shows exactly which delays AIMMS can remove, which must remain, and where the first deployment should focus.

  • 01 Asset access
  • 02 Diagnosis
  • 03 Information search
  • 04 Expert assistance
  • 05 Part identification
  • 06 Inventory confirmation
  • 07 Supplier response
  • 08 Approval
  • 09 Delivery
  • 10 Physical repair
  • 11 Testing and restart
  • 12 Documentation and closeout

Digital coordination AIMMS can remove or compress Physical work that stays with people

Not a model input

Separate from your model: what we measured.

Everything above is your arithmetic on your assumptions. The figures below are ours. They are measured, they are reported at their real scope, and they are not fed into the model, not used as a default, and not projected onto your operation. Read them as evidence that the workflow moves, then decide for yourself what it would move at your site.

Measured production evidence

One anonymized industrial production deployment

Live since
Jan 2026
Critical assets
10
Active production users
5
Operating cadence
Daily
Workflow control
Approval-gated
lower MTTR
31.7%
14.2 h to 9.7 h
Measured on the deployed repair workflow.
faster quote cycles
80.4%
4.6 d to 0.9 d
Measured on the deployed quoting workflow.
faster quote-to-order
96%
3 d to less than 1 h
Measured on the deployed quote-to-order workflow.
lower measured safety-risk exposure
50%
Approval-gated workflows
Measured on workflows with defined approval gates.

Measured in one anonymized industrial production deployment. They are not a result in your sector, a forecast, or a universal guarantee. Results vary by workflow, asset mix, data quality, operating environment, and customer controls.

Where value comes from

The operating levers behind the ROI.

Six levers move when the digital work moves. The value model on the ROI page counts only the first two, because they are the two a finance approver can defend without argument.

Counted in the model

Downtime avoided

  1. The operation changes Approved, executable work starts sooner after the fault.
  2. Which removes Hours of unavailability, at a cost per hour finance approves.

Counted in the model

Labor capacity recovered

  1. The operation changes Coordination, search, retyping and follow-up stop being the technician’s job.
  2. Which removes Hours at a loaded rate finance approves.

Deliberately not counted

Procurement leakage reduced

  1. The operation changes The part is confirmed against the asset before anything is ordered.
  2. Which removes Expedites, wrong parts, emergency buys, duplicate orders.

Deliberately not counted

Expert load reduced

  1. The operation changes The context a senior engineer would have rebuilt is already assembled.
  2. Which removes Escalations, repeat troubleshooting, after-hours dependency.

Deliberately not counted

Record quality improved

  1. The operation changes Closeout is captured while the work happens rather than from memory.
  2. Which removes Incomplete records, stale inventory, unrecorded substitutions.

Deliberately not counted

Knowledge retained

  1. The operation changes What the crew learned stays attached to the asset.
  2. Which removes The cost of rediscovering the same fault next time.

Four of these six are real and none of them is in the arithmetic. A model that counts everything it can imagine is not a stronger case, it is an easier one to reject.

One decision chain

Operating proof that maintenance, operations, and finance can use.

Maintenance and reliability

Own the operating problem

Choose the recurring failure, validate the current delay, and judge whether the workflow becomes easier to execute.

Operations and the COO

Own service and operating impact

Confirm the control boundary, return-to-service evidence, and effect on continuity and team capacity.

Finance and the CFO

Own the investment decision

Approve the economic inputs and compare measured operating value with the cost and risk of rollout.

Bring the model. Leave with a baseline that replaces it.

In 20 minutes we will map the current delay, the customer control boundary, and a first-deployment measurement plan that reports against the numbers you just entered.

One operating problem. One focused working session. No obligation.