
How to Measure a Maintenance-AI Pilot: The Clocks, Denominators and Exclusions That Decide Whether a Number Means Anything
A pilot produces a number. Whether that number means anything depends on four decisions made before the pilot started: what the clock runs between, what the denominator is, what was excluded, and what else changed. A measurement protocol, and the evidence to demand from any vendor.
Working on a live operating problem? Book Your 20-Minute Assessment
A pilot ends and produces a number. The number is usually a percentage, it is usually an improvement, and it is usually the only thing that survives into the slide that decides whether the work continues.
The number is not the measurement. The measurement is the set of decisions made before the pilot started: what the clock runs between, what population the result is divided by, which repairs were left out, and what else changed during the period. Change any one of those and the same underlying work produces a different percentage, sometimes a very different one, without anybody lying.
This is a protocol for making those decisions explicitly, and a list of what to ask for before accepting a result. It applies to a vendor’s number, to a number produced internally, and to ours.
The first decision: what the clock runs between
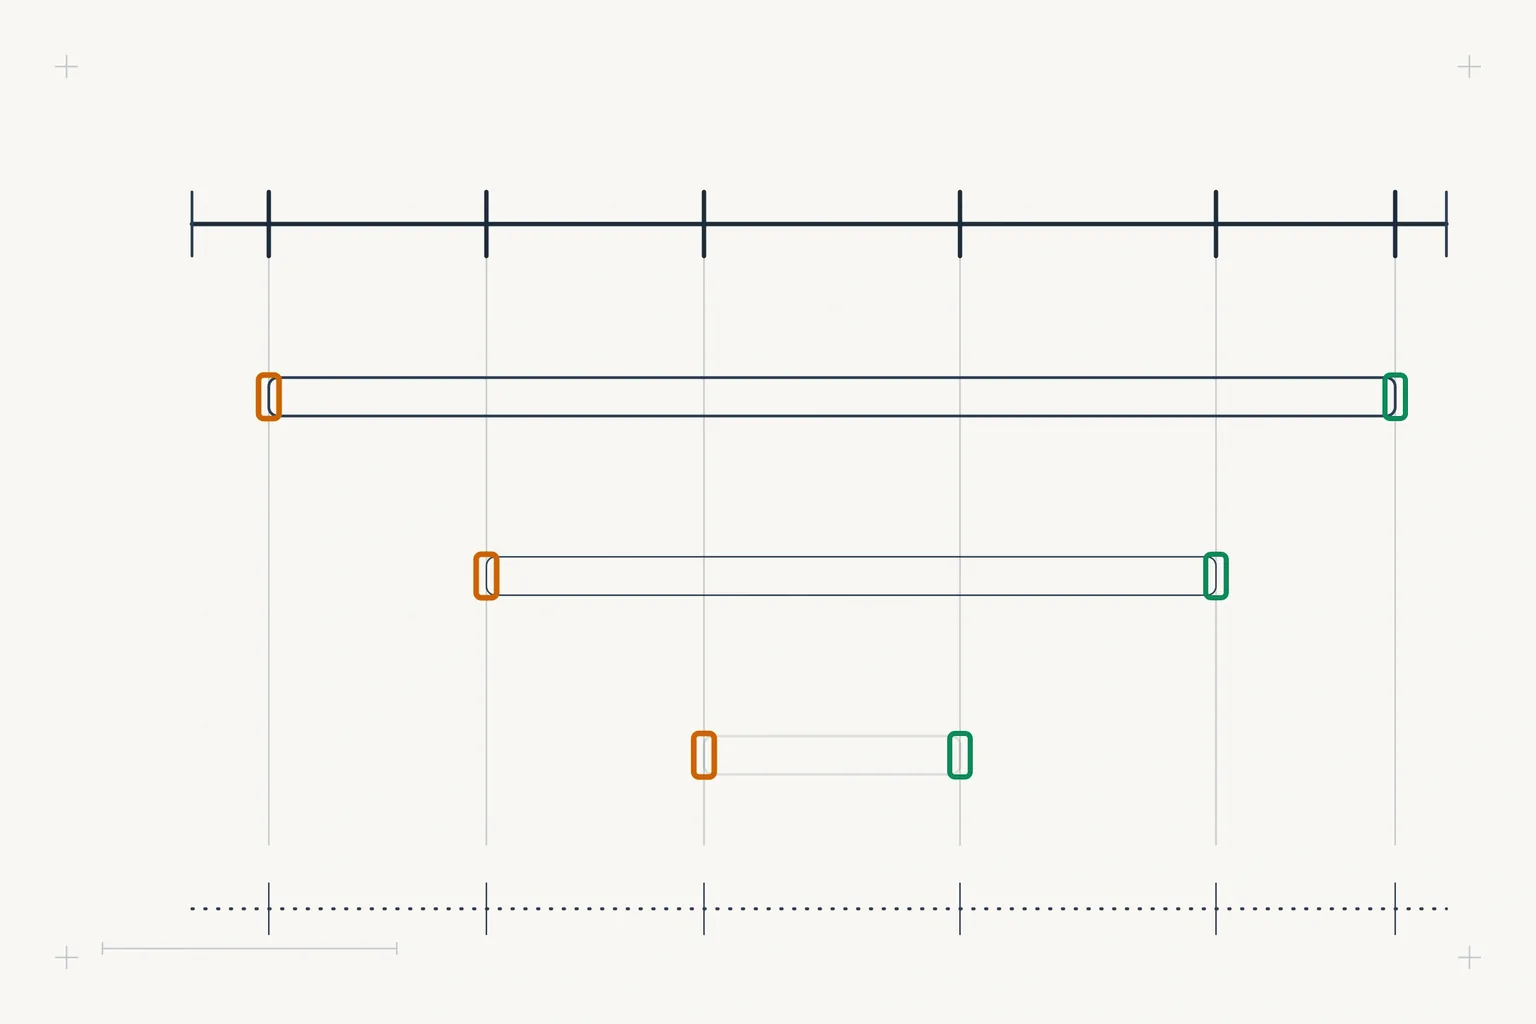
“Time to repair” names an interval without naming its ends. In practice at least three start points and three stop points are defensible, and the industry uses all of them.
The same repair, measured three defensible ways
Scroll sideways to see the whole drawing.
Figure 1. The same repair, measured three defensible ways. Three columns describing three ways of timing the same repair. The first, alarm to restored, starts when the monitoring system raises the event and stops when the asset carries load again, and it contains dispatch, diagnosis, parts, approvals and verification. The second, work order to complete, starts when a work order is created and stops when it is marked complete, and it excludes the interval before anyone opened a record and any delay after the technician stopped working. The third, on-site to tools-down, starts when a qualified person reaches the asset and stops when physical work ends, and it excludes travel, waiting for parts, and the approval that released the part. All three columns share four items: they are all called time to repair, they are all defensible, they can differ by an order of magnitude on the same event, and none of them is wrong as long as it is declared.
That last line in the third column is the one worth sitting with. If a team gets better at staging parts and worse at authorising them, on-site-to-tools-down improves while the asset is out of service for longer. A measure can move in the right direction while the plant gets worse.
The protocol requirement is not that you pick the widest interval. It is that the interval is written down before the baseline is taken, in terms of events that exist in a system with timestamps, and that the same definition is used on both sides.
The second decision: what the denominator is
“Thirty percent faster” is a ratio, and a ratio needs a population.
Four populations are commonly used and they are not interchangeable. All unplanned events on the asset class. All unplanned events on the specific assets in scope. All events of a specific failure mode. All events that entered the workflow the system actually touched.
The last one is the narrowest and the most honest, and it is also the one most likely to be quietly substituted for one of the others. If a system handles the repairs where evidence was available and a human handled the ones where it was not, then measuring only the first group measures the easy half.
State the denominator as a count, not as a category. “Forty-one unplanned events on ten assets between January and July” can be checked. “Unplanned maintenance events” cannot.
The third decision: what was excluded, and why
Every real measurement period has repairs that do not fit. Three exclusions are legitimate and one is not.
Still open at the cutoff. A repair that started in the last week of the period and is not finished has no duration yet. Dropping it is correct and it biases the result, because long repairs are more likely to be unfinished at any given cutoff. This is censoring, and the honest handling is to report how many were dropped and what their elapsed time was at the cutoff.
Escalated out of the workflow. A failure that turned into a capital replacement is not the same event as a repair. Excluding it is defensible. Not saying you excluded it is not.
Outside the declared scope. Assets that were never in the pilot, sites that were never connected. Legitimate, and it should be visible in the count.
Removed because the result was unflattering. Nothing makes this acceptable. If a repair is dropped after the numbers were seen, the measurement is no longer a measurement.
The test is simple and it is worth applying to anyone’s result including ours: were the exclusion rules written before or after the data was looked at?
The fourth decision: what else changed
A pilot runs inside an organisation that does not stand still. Over six months a maintenance group may also have hired a planner, renegotiated a supplier contract, moved to a new stockroom layout, or come out of a wet-weather season into a dry one. Any of those changes repair duration.
Three confounders are worth naming explicitly because they occur in almost every pilot.
Attention. A workflow that is being watched by the vendor, the sponsor and the team improves for reasons that have nothing to do with the software. This is real and it is not fraud, and it is why a pilot result should be read as an upper bound rather than a forecast.
Seasonality. In wastewater, wet-weather flow changes both the failure rate and the urgency. Comparing a spring baseline to an autumn measurement period measures the weather.
Selection of the first workflow. Pilots begin on the workflow somebody already believed was broken. Regression toward the mean will improve it whatever you install.
None of these can be eliminated in a single-site pilot. They can be disclosed, and a result that discloses them is more credible than one that does not.
Approval-gated risk is a different kind of measure
Duration measures are continuous and they have a natural clock. A safety or authority measure does not, and it should not be reported as though it did.
What can be counted honestly is discrete: how many actions in the period required an approval gate, how many were presented to the authorised owner with the evidence already attached, how many proceeded without a gate that policy required, and how many were stopped at a gate and revalidated before work resumed. Those are counts of events with receipts, not estimates.
This matters beyond bookkeeping. In December 2025 the Cybersecurity and Infrastructure Security Agency and eight partner agencies published Principles for the Secure Integration of Artificial Intelligence in Operational Technology, which asks organisations to “Limit active control of OT infrastructure by AI without a human in the loop to account for safety concerns and latency limitations” and to “Establish failsafe mechanisms that enable AI systems to fail gracefully without disrupting critical operations”. A pilot that cannot produce a count of gates honoured and gates missed cannot demonstrate compliance with either sentence. The measurement and the control are the same record.
What our own published figures rest on
This site publishes four measured figures. Applying the protocol above to them is the only way the protocol is worth anything.
| What is published | What it rests on |
|---|---|
| 31.7% lower mean time to repair, 14.2 hours to 9.7 hours | One anonymized industrial production deployment |
| 80.4% faster quote cycles, 4.6 days to 0.9 days | The same deployment, quote workflow |
| 96% faster quote to order, 3 days to under 1 hour | The same deployment, quote-to-order workflow |
| 50% lower measured safety-risk exposure | The same deployment, approval-gated workflows only |
The deployment behind all four has been live since January 2026. It covers ten critical assets, five active production users, a daily operating cadence, and approval-gated workflow control.
Four things follow from that, and they are the reason the figures are stated the way they are.
It is one deployment, so it is a result, not a rate. A single site cannot establish that a second site will behave the same way, and no number of significant figures changes that.
It is ten assets, which is a small population. A small population produces a point estimate with a wide interval around it, and the honest reading of 31.7 percent is that the effect was large, not that the effect is 31.7 percent.
Mean time to repair is time to repair. It is not total downtime, which is a larger quantity, and restating it as a downtime reduction claims something the deployment did not measure.
The safety figure is scoped to approval-gated workflows, and that scope is not decoration. It names the population the measure was taken on.
We publish these because a company that asks buyers to demand evidence has to show its own. What we have is one deployment’s numbers with their conditions attached. It is not a sector result, it is not a forecast, and it is not a guarantee.
What to demand before believing any result
Ask for these six items in writing. They are all cheap for an honest vendor to produce and expensive for a dishonest one.
| Ask for | What a good answer looks like |
|---|---|
| The clock definition | Two named events with timestamps in a named system, identical on baseline and measurement |
| The denominator, as a count | “Forty-one events on ten assets between two dates”, not a category name |
| The exclusion rules and their date | Rules written before the data was examined, with the excluded count reported |
| The confounders | A list of what else changed in the period, volunteered rather than extracted |
| The gate record | Counts of approvals required, honoured, missed and revalidated |
| The baseline method | How the before-state was reconstructed, and from which records |
If a vendor cannot answer the first two, the number is not a measurement and should not enter a business case. If they can answer all six, you can disagree with the result and still trust the process, which is the condition under which a pilot is worth running at all.
Where AIMMS fits
EQUA AIMMS is built so that the measurement and the operating record are the same artifact rather than two exercises.
Apply this article to us on one more axis, because it now applies. AIMMS detects anomalies and deviations in read-only SCADA, historian and sensor data and can raise the fault itself. A detection claim is a prediction claim, and prediction is judged on different quantities than coordination: the false positive rate, the missed detections, the lead time between the warning and the failure, and the denominator of events the detector was even watching. Ask for those separately from any MTTR figure. A vendor who answers a detection question with a coordination number, ourselves included, has changed the subject. Every permitted action records the actor, the timestamp, the evidence it used, the decision, the approval state and the resulting status, which is what makes a clock definition checkable after the fact instead of reconstructed from memory.
An initial deployment is scoped at five to ten critical assets, and six operating measures are taken against a baseline the customer sets at the start rather than one we supply. The customer-specific value model works the same way: finance provides every input, the formulas stay visible, and nothing measured in our production deployment is used to produce anything in it.
The boundaries are the ones that apply everywhere on this site. Operational context is read only, AIMMS holds no write path to plant control systems and issues no setpoints, restarts, interlocks or actuator commands, and qualified people perform the work and authorise return to service.
The question worth asking first
Before the pilot, not after: if this works, what number will we point at, and where will the two timestamps behind it come from.
If nobody can answer that in the first meeting, the pilot has already been designed to produce an anecdote. Most of them are.
Sources
- Cybersecurity and Infrastructure Security Agency, Australian Signals Directorate’s Australian Cyber Security Centre, National Security Agency Artificial Intelligence Security Center, Federal Bureau of Investigation, Canadian Centre for Cyber Security, Germany’s Federal Office for Information Security, National Cyber Security Centre of the Netherlands, National Cyber Security Centre New Zealand, and National Cyber Security Centre United Kingdom, Principles for the Secure Integration of Artificial Intelligence in Operational Technology, 3 December 2025. Quoted: “Limit active control of OT infrastructure by AI without a human in the loop to account for safety concerns and latency limitations” and “Establish failsafe mechanisms that enable AI systems to fail gracefully without disrupting critical operations.”
- EQUA AI production deployment facts as published on this site: one anonymized industrial production deployment, live since January 2026, ten critical assets, five active production users, daily operating cadence, approval-gated workflow control. The four measured figures and their per-workflow scope are stated on the value model page.